empty
12.11.2024 05:03 AM
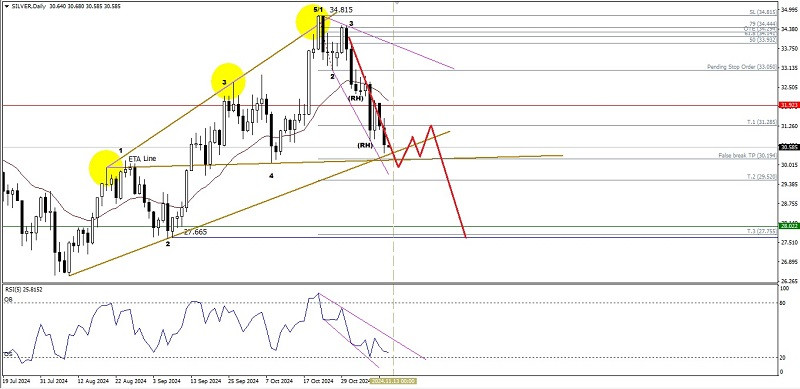
Technical Analysis of Daily Price Movement of Silver Commodity Asset, Tuesday November 12, 2024.

This image is no longer relevant

On the daily chart, the Silver commodity asset appears to have an Ascending Broadening Wedge pattern which also indirectly forms a Three Little Indian and Wolf Waves reversal pattern, coupled with the appearance of a Bearish 123 pattern followed by several Bearish Ross Hook (RH) which further strengthens the probability of Silver weakening in the next few days where the level of 30.194 will be tested by this commodity asset if this level, which coincidentally is also the ETA Line level of Wolf Waves, is successfully broken and closes below it, then Silver will continue to weaken to the level of 29.520 and if the momentum and volatility support it, then 28.022 will be the next target to be aimed for, but please note that with the appearance of a Descending Broadening Wedge pattern in its price movement with the RSI indicator (5) which gives an indication of a weakening downward momentum, there is the potential for a reversal that will make Silver strengthen again, but as long as the strengthening does not broken and close above the level of 33.050, Silver will weaken again down towards the target levels that have been described previously.

(Disclaimer)

Select timeframe
5
min
15
min
30
min
1
hour
4
hours
1
day
1
week
Earn on cryptocurrency rate changes with InstaForex
Download MetaTrader 4 and open your first trade
  • Grand Choice
    Contest by
    InstaForex
    InstaForex always strives to help you
    fulfill your biggest dreams.
    JOIN CONTEST

Recommended Stories

Trading Signals for GOLD (XAU/USD) for April 14-17, 2024: sell below $3,224 (+1/8 Murray - 21 SMA)

Our trading plan for the coming hours is to sell gold below 3,224, with targets at 3,203 and 3,156. We should be alert to any technical rebound, as the outlook

Dimitrios Zappas 15:59 2025-04-14 UTC+2

Forecast for EUR/USD on April 14, 2025

On Friday, the EUR/USD pair continued to rise but pulled back in the second half of the day. The decline (i.e., dollar strengthening) was short-lived

Samir Klishi 12:28 2025-04-14 UTC+2

Forecast for GBP/USD on April 14, 2025

On the hourly chart, the GBP/USD pair continued its upward movement on Friday and today is on track to reach the 1.3151 level. A bounce from this level will favor

Samir Klishi 12:25 2025-04-14 UTC+2

Technical Analysis of Intraday Price Movement of Crude Oil Commodity Instrument, Monday April 24, 2025.

On the 4-hour chart of the Crude Oil commodity instrument, the Inverted Head & Shoulders pattern and Bullish Pattern 123 and Divergence between the #CL price movement and the Stochastic

Arief Makmur 07:19 2025-04-14 UTC+2

Technical Analysis of Intraday Price Movement of Palladium vs USD Commodity Instrument, Monday April 24, 2025.

With the appearance of Divergence from the Stochastic Oscillator indicator with the XPD/USD price movement on its 4-hour chart and the appearance of a Bullish 123 pattern followed

Arief Makmur 07:19 2025-04-14 UTC+2

#SPX – Summary and Outlook

Last week, even though there was a bearish gap, bullish players were able to reclaim their ground effectively. The market is now approaching the point where it may eliminate

Evangelos Poulakis 00:58 2025-04-14 UTC+2

Trading Signals for EUR/USD for April 11-15, 2025: sell below 1.1470 (+2/8 Murray - overbought)

During the European session, the euro reached a new high around +2/8 Murray, located at 1.1473. This movement in EUR/USD occurred after the announcement by China's Ministry of Finance that

Dimitrios Zappas 16:44 2025-04-11 UTC+2

Trading Signals for GOLD (XAU/USD) for April 11-13, 2025: sell below $3,235 (+1/8 Murray - overbought)

Early in the American session, gold is undergoing a strong technical correction after reaching a new high around 3,237.69 for now. Economic data from the United States will be released

Dimitrios Zappas 16:04 2025-04-11 UTC+2

EUR/USD – April 11th. The Dollar's Decline Shows No Sign of Stopping

On Thursday, the EUR/USD pair spent the entire day in an upward move, gaining 400 points and approaching the 261.8% Fibonacci corrective level at 1.1318. A rebound from this level

Samir Klishi 12:36 2025-04-11 UTC+2

Forecast for GBP/USD on April 11, 2025

On the hourly chart, the GBP/USD pair continued its upward movement on Thursday and secured a position above the 127.2% corrective level at 1.3003 – by Friday morning. This suggests

Samir Klishi 12:32 2025-04-11 UTC+2
Can't speak right now?
Ask your question in the chat.
Widget callback
 

Dear visitor,

Your IP address shows that you are currently located in the USA. If you are a resident of the United States, you are prohibited from using the services of InstaFintech Group including online trading, online transfers, deposit/withdrawal of funds, etc.

If you think you are seeing this message by mistake and your location is not the US, kindly proceed to the website. Otherwise, you must leave the website in order to comply with government restrictions.

Why does your IP address show your location as the USA?

  • - you are using a VPN provided by a hosting company based in the United States;
  • - your IP does not have proper WHOIS records;
  • - an error occurred in the WHOIS geolocation database.

Please confirm whether you are a US resident or not by clicking the relevant button below. If you choose the wrong option, being a US resident, you will not be able to open an account with InstaForex anyway.

We are sorry for any inconvenience caused by this message.