empty
04.10.2023 10:30 AM
EUR/USD and GBP/USD: Trading plan for beginner traders on October 4, 2023

Details of the Economic Calendar on October 3

The number of open vacancies in the USA has significantly increased, rising by 690,000 compared to the previous month, reaching 9.61 million in August 2023. This growth significantly exceeded the consensus forecast, which expected 8.8 million open vacancies. These data indicate the resilience of the labor market, despite the actions of the Federal Reserve System to tighten monetary policy.

Analysis of Trading Charts from October 3

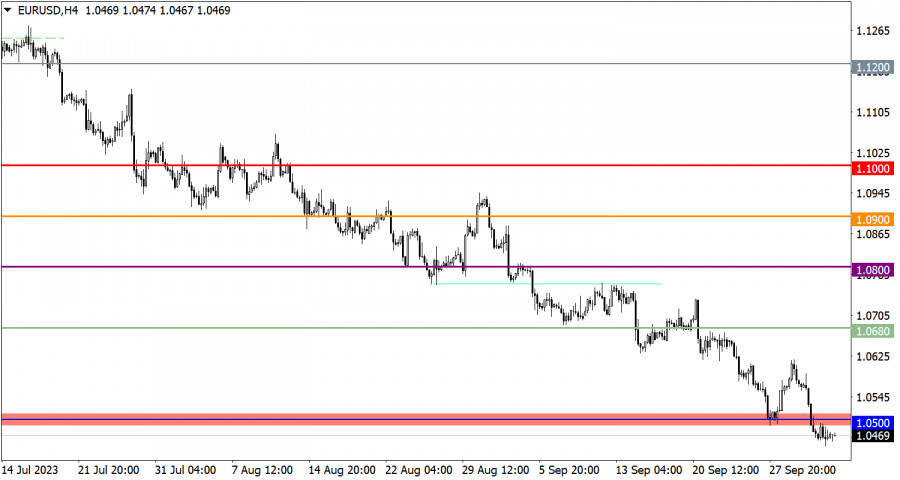
The EUR/USD currency pair managed to stabilize below the 1.0500 level, despite a pronounced technical signal of oversold conditions. This movement indicates a prevailing bearish sentiment among market participants.

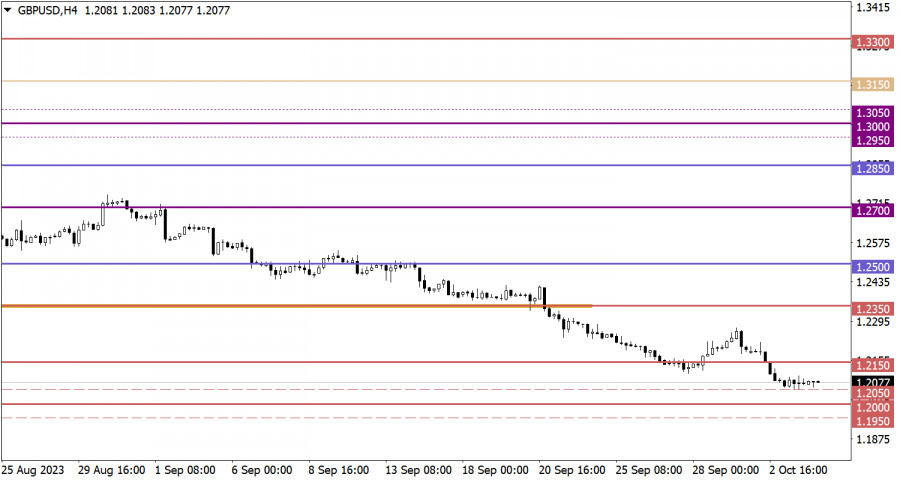
On the other hand, the GBP/USD pair reached the upper boundary of the psychological level of 1.2000/1.2050 during its momentum. This led to a reduction in short positions and, as a result, a temporary slowdown in the downward trend.

This image is no longer relevant

Economic Calendar for October 4

Today, the final data on business activity indices in the services sector for Europe, the United Kingdom, and the United States are expected to be published. If these indicators align with preliminary estimates, there may not be a significant market reaction. However, speculators may pay special attention to the publication of producer price data in the EU. Forecasts suggest an acceleration of the rate of decline from -7.6% to -11.6%. This indicates ongoing deflation, which, in turn, could signal an imminent reduction in interest rates by the regulator.

During the American trading session, particular attention will be given to the ADP employment report in the private sector of the United States. It is expected that this report will show employment growth at the level of 160,000, which may indicate a slowdown in the U.S. labor market.

EUR/USD Trading Plan for October 4

It is expected that further growth in short positions in the euro may occur if the price remains below the 1.0450 level. In this case, a decline in price to the level of 1.0350 is possible. Regarding corrective movement, for its consideration relative to these levels, the price needs to return above the 1.0500 level, at least on a four-hour basis.

This image is no longer relevant

GBP/USD Trading Plan for October 4

Despite an obvious technical signal of oversold conditions for the British pound, the bearish sentiment still prevails in the market. Therefore, the current consolidation may serve as a phase of trader repositioning. If the price stays below the 1.2050 level, it may lead to further declines in quotes, possibly down to the lower boundary of the psychological level of 1.1950/1.2000. As for corrective movement, it would require the price to first return above the 1.2100 level.

This image is no longer relevant

What's on the charts

The candlestick chart type is white and black graphic rectangles with lines above and below. With a detailed analysis of each individual candle, you can see its characteristics relative to a particular time frame: opening price, closing price, intraday high and low.

Horizontal levels are price coordinates, relative to which a price may stop or reverse its trajectory. In the market, these levels are called support and resistance.

Circles and rectangles are highlighted examples where the price reversed in history. This color highlighting indicates horizontal lines that may put pressure on the asset's price in the future.

The up/down arrows are landmarks of the possible price direction in the future.

Gven Podolsky,
Analytical expert of InstaForex
© 2007-2025
Select timeframe
5
min
15
min
30
min
1
hour
4
hours
1
day
1
week
Earn on cryptocurrency rate changes with InstaForex
Download MetaTrader 4 and open your first trade
  • Grand Choice
    Contest by
    InstaForex
    InstaForex always strives to help you
    fulfill your biggest dreams.
    JOIN CONTEST

Recommended Stories

GBP/USD: Trading Plan for the U.S. Session on May 1st (Review of the Morning Trades)

In my morning forecast, I focused on the 1.3282 level and planned to make entry decisions based on it. Let's take a look at the 5-minute chart and see what

Miroslaw Bawulski 18:42 2025-05-01 UTC+2

EUR/USD: Trading Plan for the U.S. Session on May 1st (Review of the Morning Trades)

In my morning forecast, I focused on the 1.1320 level and planned to make market entry decisions based on it. Let's take a look at the 5-minute chart

Miroslaw Bawulski 18:38 2025-05-01 UTC+2

How to Trade the GBP/USD Currency Pair on May 1? Simple Tips and Trade Analysis for Beginners

The GBP/USD pair also showed a downward movement on Wednesday, for which there were no valid reasons. There were no noteworthy events in the UK yesterday, while the U.S. released

Paolo Greco 06:42 2025-05-01 UTC+2

How to Trade the EUR/USD Currency Pair on May 1? Simple Tips and Trade Analysis for Beginners

Wednesday's Trade Analysis: 1H chart of the EUR/USD pair. The EUR/USD currency pair continued its downward movement within the sideways channel on the hourly time frame on Wednesday —

Paolo Greco 06:40 2025-05-01 UTC+2

GBP/USD: Trading Plan for the U.S. Session on April 30th (Review of Morning Trades)

In my morning forecast, I drew attention to the 1.3376 level and planned to base market entry decisions on it. Let's take a look at the 5-minute chart and analyze

Miroslaw Bawulski 13:15 2025-04-30 UTC+2

EUR/USD: Trading Plan for the U.S. Session on April 30th (Review of Morning Trades)

In my morning forecast, I drew attention to the 1.1378 level and planned to base market entry decisions on it. Let's look at the 5-minute chart and analyze what happened

Miroslaw Bawulski 13:13 2025-04-30 UTC+2

How to Trade the GBP/USD Pair on April 30? Simple Tips and Trade Analysis for Beginners

Analysis of Tuesday's Trades 1H Chart of GBP/USD On Tuesday, the GBP/USD pair corrected downward after another surge on Monday. No fundamental or macroeconomic reasons supported such movements on either

Paolo Greco 06:04 2025-04-30 UTC+2

How to Trade the EUR/USD Pair on April 30? Simple Tips and Trade Analysis for Beginners

Analysis of Tuesday's Trades 1H Chart of EUR/USD On Tuesday, the EUR/USD currency pair continued to trade within a sideways channel, which is now visible on virtually any timeframe

Paolo Greco 06:04 2025-04-30 UTC+2

Trading Recommendations and Analysis for GBP/USD on April 30: The Pound Has Cooled Down, But for How Long?

On Tuesday, the GBP/USD currency pair failed to continue the upward movement it had started so vigorously on Monday. It is worth recalling that there were no solid reasons

Paolo Greco 03:29 2025-04-30 UTC+2

Trading Recommendations and Analysis for EUR/USD on April 30: The Market Remains in a State of Hibernation

The EUR/USD currency pair continued to trade within a sideways channel throughout Tuesday. The flat movement is visible in the chart above. Last week, the pair briefly broke

Paolo Greco 03:29 2025-04-30 UTC+2
Can't speak right now?
Ask your question in the chat.
Widget callback
 

Dear visitor,

Your IP address shows that you are currently located in the USA. If you are a resident of the United States, you are prohibited from using the services of InstaFintech Group including online trading, online transfers, deposit/withdrawal of funds, etc.

If you think you are seeing this message by mistake and your location is not the US, kindly proceed to the website. Otherwise, you must leave the website in order to comply with government restrictions.

Why does your IP address show your location as the USA?

  • - you are using a VPN provided by a hosting company based in the United States;
  • - your IP does not have proper WHOIS records;
  • - an error occurred in the WHOIS geolocation database.

Please confirm whether you are a US resident or not by clicking the relevant button below. If you choose the wrong option, being a US resident, you will not be able to open an account with InstaForex anyway.

We are sorry for any inconvenience caused by this message.