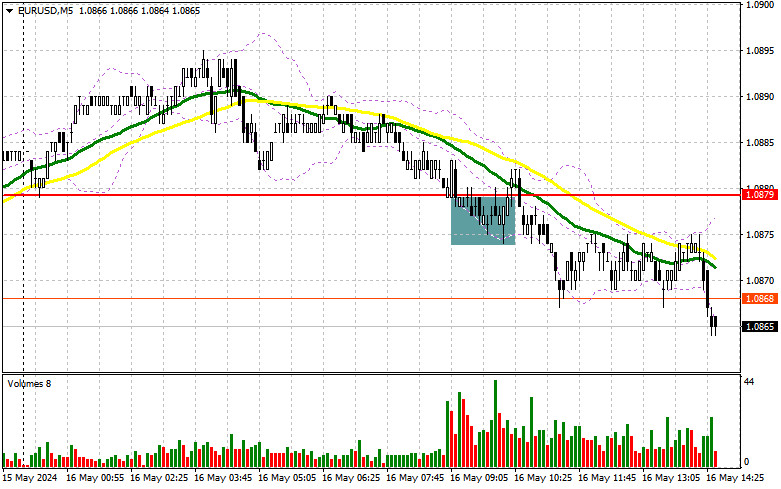
In my morning forecast, I emphasized the level of 1.0879 and planned to make decisions based on it for market entry. Let's look at the 5-minute chart and figure out what happened there. The decline and the formation of a false breakout at this level provided an excellent entry point for long positions that continued yesterday's trend. But, as you can see on the chart, the expected upward surge of the euro did not materialize. The technical picture was revised for the second half of the day.
To open long positions on EUR/USD, the following is required:
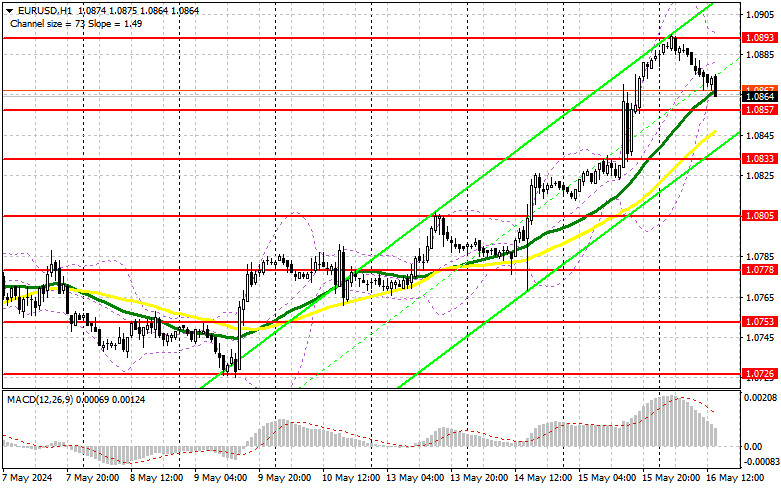
The absence of important statistics on the European economy prolonged the downward correction of the pair observed throughout the first half of the day. The euro could decline even further, as there is quite interesting data from the US ahead of us, which can boost demand for the US dollar. In the second half of the day, we await figures on initial jobless claims, the Philadelphia Fed Manufacturing Index, and data related to real estate. Most likely, it will be the data on the number of new housing starts and building permits issued that could lead to a surge in volatility, and a good report on changes in industrial production could lead to a larger correction in EUR/USD, which I plan to take advantage of around 1.0857. At that point, the moving averages intersect, favoring the bulls. The formation of a false breakout around 1.0857 would be a suitable scenario for entering the market, counting on further pair growth and a return to the morning high of 1.0893. Breaking and updating this range from top to bottom will strengthen the pair with a chance of a surge to 1.0918 - a new monthly high. The ultimate target will be a maximum of 1.0942, where I will take profit. In the scenario of EUR/USD decline and lack of activity around 1.0857 in the second half of the day, the pressure on the pair will return, leading to a larger decline and covering all of yesterday's growth. In that case, I will enter only after the formation of a false breakout around the next support of 1.0833, which performed excellently yesterday. I plan to open long positions immediately on a rebound from 1.0805 with a target of an upward correction of 30-35 points within the day.
To open short positions on EUR/USD, the following is required:
Sellers are making quite successful attempts, putting pressure on the euro. Of course, under the current conditions, it is difficult to expect a larger sell-off of the pair, although if US data turns out to be significantly better than economists' forecasts, the euro may decline significantly. Disappointing statistics, however, will lead to the growth of EUR/USD. In such a case, I will act after an unsuccessful breakout above 1.0893. Protection and forming a false breakout will be suitable for opening short positions with the prospect of euro decline and retesting support at 1.0857. Breaking and consolidating below this range and a reverse test from bottom to top will provide another selling point, with the pair moving towards the minimum of 1.0833, where euro buyers were very active yesterday. The ultimate target will be a minimum of 1.0805, where I will take profit. Testing this level will indicate the pair being locked in a sideways channel. In the case of upward movement of EUR/USD in the second half of the day and the absence of bears at 1.0893, which is likely to be the case, buyers will have a chance to build a new bullish market. In such a case, I will postpone sales until the next resistance test at 1.0918. I will also sell there, but only after an unsuccessful consolidation. I plan to open short positions immediately on a rebound from 1.0942 with a target of a downward correction of 30-35 points.

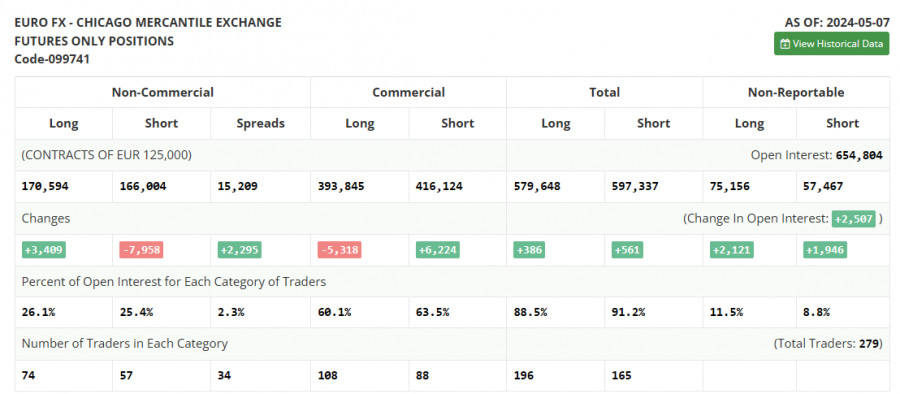
In the COT report (Commitment of Traders) for May 7th, there was a decrease in short positions and an increase in long ones. All this indicates that demand for risky assets is maintained but rather weak after central bank meetings. The fact that the number of long and short positions is almost equal also indicates the absence of an advantage for either side, which is confirmed by the chart. Now, traders will wait for new statistics and benchmarks, and until then, trading will continue in a sideways channel, with a slight advantage for buyers of risky assets. The COT report noted that long non-commercial positions increased by 3,409 to 170,594, while short non-commercial positions plummeted by 7,958 to 166,004. As a result, the spread between long and short positions increased by 2,295.
Indicator Signals:
Moving Averages
Trading is conducted above the 30 and 50-day moving averages, indicating further pair growth.
Note: The author considers the period and prices of moving averages on the hourly chart H1, which differs from the general definition of classic daily moving averages on the daily chart D1.
Bollinger Bands
In case of a decline, the indicator's lower boundary, around 1.0860, will act as support.
Indicator Descriptions:
- Moving Average (determines the current trend by smoothing out volatility and noise). Period 50. Marked on the chart in yellow.
- Moving Average (determines the current trend by smoothing out volatility and noise). Period 30. Marked on the chart in green.
- MACD Indicator (Moving Average Convergence/Divergence). Fast EMA period 12. Slow EMA period 26. SMA period 9.
- Bollinger Bands. Period 20.
- Non-commercial traders are speculators, such as individual traders, hedge funds, and large institutions, who use the futures market for speculative purposes and meet certain requirements.
- Long non-commercial positions represent the total long open position of non-commercial traders.
- Short non-commercial positions represent the total short open positions of non-commercial traders.
- The total non-commercial net position is the difference between non-commercial traders' short and long positions.


