сила сигнала 2 из 5

По #Bitcoin на M15 сформировалась фигура «Бычий симметричный треугольник». Нижняя граница фигуры имеет координаты 83167.44/83888.94, при этом верхняя граница 84422.11/83888.94. Формирование фигуры «Бычий симметричный треугольник» наиболее вероятным образом свидетельствует о продолжении восходящего тренда. Это означает, что курс #Bitcoin, в случае срабатывания фигуры, пробьет верхнюю границу и направится к значению 83889.16.
Таймфреймы М5 и М15 могут иметь больше ложных точек входа.
- Все
- Вымпел
- Голова и плечи
- Двойная вершина
- Прямоугольник
- Треугольник
- Тройная вершина
- Флаг
- Все
- #AAPL
- #AMZN
- #Bitcoin
- #EBAY
- #FB
- #GOOG
- #INTC
- #KO
- #MA
- #MCD
- #MSFT
- #NTDOY
- #PEP
- #TSLA
- #TWTR
- AUDCAD
- AUDCHF
- AUDJPY
- AUDUSD
- EURCAD
- EURCHF
- EURGBP
- EURJPY
- EURNZD
- EURRUB
- EURUSD
- GBPAUD
- GBPCHF
- GBPJPY
- GBPUSD
- GOLD
- NZDCAD
- NZDCHF
- NZDJPY
- NZDUSD
- SILVER
- USDCAD
- USDCHF
- USDJPY
- USDRUB
- Все
- M5
- M15
- M30
- H1
- D1
- Все
- Покупка
- Продажа
- Все
- 1
- 2
- 3
- 4
- 5
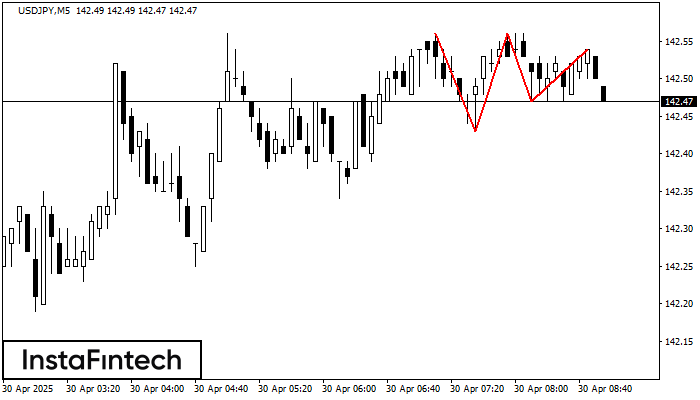
The Triple Top pattern has formed on the chart of the USDJPY M5. Features of the pattern: borders have an ascending angle; the lower line of the pattern
The M5 and M15 time frames may have more false entry points.
Open chart in a new window
According to the chart of M5, USDCHF formed the Bearish Symmetrical Triangle pattern. This pattern signals a further downward trend in case the lower border 0.8226 is breached. Here
The M5 and M15 time frames may have more false entry points.
Open chart in a new window
The Triple Bottom pattern has formed on the chart of GBPAUD M5. Features of the pattern: The lower line of the pattern has coordinates 2.0938 with the upper limit 2.0938/2.0931
The M5 and M15 time frames may have more false entry points.
Open chart in a new window