signal strength 3 of 5

The Bearish Flag pattern has been formed on EURJPY at M30. The lower boundary of the pattern is located at 162.05/162.27 while the upper boundary lies at 162.33/162.55. The projection of the flagpole is 88 points. This formation signals that the downward trend is most likely to continue. Therefore, if the level of 162.05 is broken, the price will move further downwards.
See Also
- All
- Double Top
- Flag
- Head and Shoulders
- Pennant
- Rectangle
- Triangle
- Triple top
- All
- #AAPL
- #AMZN
- #Bitcoin
- #EBAY
- #FB
- #GOOG
- #INTC
- #KO
- #MA
- #MCD
- #MSFT
- #NTDOY
- #PEP
- #TSLA
- #TWTR
- AUDCAD
- AUDCHF
- AUDJPY
- AUDUSD
- EURCAD
- EURCHF
- EURGBP
- EURJPY
- EURNZD
- EURRUB
- EURUSD
- GBPAUD
- GBPCHF
- GBPJPY
- GBPUSD
- GOLD
- NZDCAD
- NZDCHF
- NZDJPY
- NZDUSD
- SILVER
- USDCAD
- USDCHF
- USDJPY
- USDRUB
- All
- M5
- M15
- M30
- H1
- D1
- All
- Buy
- Sale
- All
- 1
- 2
- 3
- 4
- 5
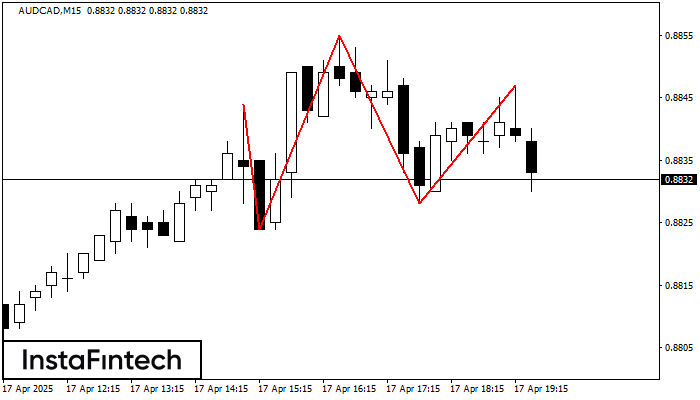
The AUDCAD M15 formed the Head and Shoulders pattern with the following features: The Head’s top is at 0.8855, the Neckline and the upward angle are at 0.8824/0.8828. The formation
The M5 and M15 time frames may have more false entry points.
Open chart in a new window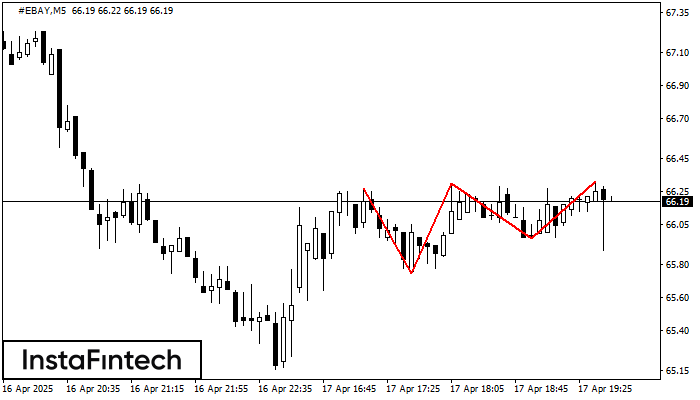
The Triple Top pattern has formed on the chart of the #EBAY M5. Features of the pattern: borders have an ascending angle; the lower line of the pattern
The M5 and M15 time frames may have more false entry points.
Open chart in a new window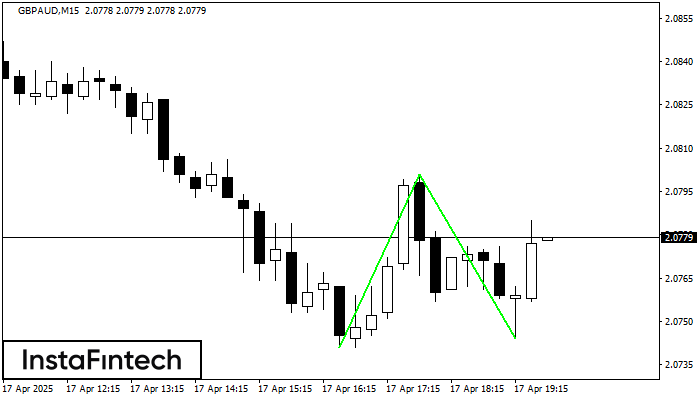
The Double Bottom pattern has been formed on GBPAUD M15; the upper boundary is 2.0801; the lower boundary is 2.0744. The width of the pattern is 60 points. In case
The M5 and M15 time frames may have more false entry points.
Open chart in a new window