empty
30.01.2024 03:53 PM
Trading Signals for BITCOIN (BTC/USD) on January 30-31, 2024: sell below $43,750 (4/8 Murray - 200 EMA)

This image is no longer relevant

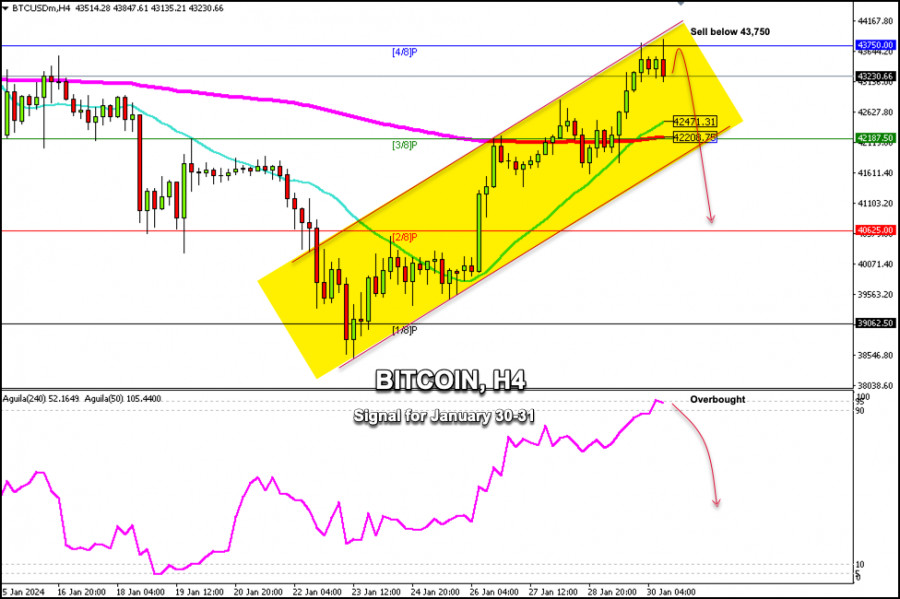
Early in the American session, Bitcoin is trading around 43,230 after having reached 4/8 Murray which represents strong resistance around 43,750. Bitcoin is showing signs of a probable technical correction in the coming hours. The key will be for the crypto leader to trade below 43,750, then it could return to levels of the 200 EMA located at 42,200 and or towards the 21 SMA located at 42,471.

In case the bearish force prevails and if Bitcoin breaks the bullish trend channel forming since January 23, the price could return towards 2/8 Murray at 40,650 and could even consolidate around the psychological level of $40,000.

If Bitcoin consolidates above 43,750 in the next few hours, we could expect it to reach the $45,000 level, but given that the eagle indicator is showing a sign of an extremely overbought market, it is likely that Bitcoin will consolidate below 43,750. This could be seen as a signal to sell.

If Bitcoin falls and bounces around the 200 EMA located at 42,208, this would be a good point to resume buying, since this area keeps BTC with a positive outlook. Since the eagle indicator is overbought now, with a technical correction, it could get relief and show a bullish signal again which would be seen as an opportunity to buy above 3/8 Murray (42,187).

Our strategy for the next few hours will be to sell Bitcoin below 43,750 with targets at 42,205 and 40,625. The eagle indicator is showing signs of an imminent technical correction which supports our bearish strategy.

Dimitrios Zappas,
Especialista em análise na InstaForex
© 2007-2025
Selecionar intervalo de tempo
5
min
15
min
30
min
1
hora
4
horas
1
dia
1
s.
Ganhe com as variações das taxas das criptomoedas com a InstaForex.
Baixe o MetaTrader 4 e abra a sua primeira operação.
  • Grand Choice
    Contest by
    InstaForex
    InstaForex always strives to help you
    fulfill your biggest dreams.
    PARTICIPE DO CONCURSO

Recommended Stories

Análise técnica do movimento intradiário de preços do USD/JPY, quinta-feira, 08 de maio de 2025

No gráfico de 4 horas do principal par de moedas, o USD/JPY, embora apresente sinais de fortalecimento — evidenciado pelo movimento de preços acima da média móvel exponencial

Arief Makmur 16:56 2025-05-08 UTC+2

Análise técnica do movimento intradiário de preços do índice Nasdaq 100, quinta-feira, 08 de maio de 2025

Com a formação de uma divergência entre o movimento de preços do índice Nasdaq 100 e o indicador Oscilador Estocástico — enquanto o preço se mantém acima da média móvel

Arief Makmur 16:45 2025-05-08 UTC+2

Previsão para o EUR/USD para 8 de maio de 2025

Como esperado, o Federal Reserve manteve sua política monetária inalterada após a reunião de ontem. Jerome Powell apenas reforçou levemente as expectativas do mercado em relação à inflação. Os mercados

Laurie Bailey 15:24 2025-05-08 UTC+2

Previsão para o GBP/USD para 8 de maio de 2025

Na reunião de hoje, espera-se que o Banco da Inglaterra reduza a taxa básica de juros de 4,50% para 4,25%. A mídia especializada afirma que o mercado já precificou esse

Laurie Bailey 15:20 2025-05-08 UTC+2

GBP/USD. 8 de maio. Traders confusos antes da reunião do Banco da Inglaterra

No gráfico horário, o par GBP/USD na quarta-feira não conseguiu continuar seu movimento ascendente. Durante a noite, consolidou-se abaixo do nível 1,3344-1,3357, depois se recuperou rapidamente para esta zona

Samir Klishi 15:03 2025-05-08 UTC+2

Previsão para o EUR/USD em 8 de maio de 2025

Na quarta-feira, o par EUR/USD se recuperou duas vezes da zona de resistência de 1,1374-1,1383, reverteu a favor do dólar americano e começou um novo declínio em direção ao nível

Samir Klishi 14:46 2025-05-08 UTC+2

GBP/USD. Análise e previsão

Hoje, o par GBP/USD recua após o impulso altista observado ontem, com o movimento corretivo sendo sustentado pela modesta força do dólar norte-americano. Do ponto de vista técnico

Irina Yanina 20:51 2025-05-07 UTC+2

Sinais de negociação para o OURO (XAU/USD) para 7 a 9 de maio de 2025: comprar acima de $3.360 (SMA 21 - 8/8 de Murray)

No início da sessão americana, o ouro está sendo negociado em torno de US$ 3.382, recuperando-se após atingir uma mínima de US$ 3.359 na abertura do mercado. Uma forte recuperação

Dimitrios Zappas 20:46 2025-05-07 UTC+2

Análise técnica do movimento intradiário de preços do gás natural, quarta-feira, 07 de maio de 2025

No gráfico de 4 horas, o Gás Natural (NG) apresenta um padrão de baixa 123, seguido por um Gancho de Ross (RH) de continuação da tendência de queda. Além disso

Arief Makmur 16:51 2025-05-07 UTC+2

Análise técnica do movimento intradiário de preços do AUD/JPY, quarta-feira, 07 de maio de 2025

Ao analisarmos o gráfico de 4 horas do par cruzado AUD/JPY, observamos a formação de um padrão de Cunha Descendente Ampliada, o que sinaliza um possível fortalecimento

Arief Makmur 16:33 2025-05-07 UTC+2
Não pode falar agora?
Faça sua pergunta no chat.
Widget callback
 

Dear visitor,

Your IP address shows that you are currently located in the USA. If you are a resident of the United States, you are prohibited from using the services of InstaFintech Group including online trading, online transfers, deposit/withdrawal of funds, etc.

If you think you are seeing this message by mistake and your location is not the US, kindly proceed to the website. Otherwise, you must leave the website in order to comply with government restrictions.

Why does your IP address show your location as the USA?

  • - you are using a VPN provided by a hosting company based in the United States;
  • - your IP does not have proper WHOIS records;
  • - an error occurred in the WHOIS geolocation database.

Please confirm whether you are a US resident or not by clicking the relevant button below. If you choose the wrong option, being a US resident, you will not be able to open an account with InstaForex anyway.

We are sorry for any inconvenience caused by this message.