signal strength 2 of 5

The Triple Bottom pattern has been formed on NZDJPY M15. It has the following characteristics: resistance level 84.49/84.47; support level 84.31/84.32; the width is 18 points. In the event of a breakdown of the resistance level of 84.49, the price is likely to continue an upward movement at least to 84.54.
The M5 and M15 time frames may have more false entry points.
Veja também
- All
- Double Top
- Flag
- Head and Shoulders
- Pennant
- Rectangle
- Triangle
- Triple top
- All
- #AAPL
- #AMZN
- #Bitcoin
- #EBAY
- #FB
- #GOOG
- #INTC
- #KO
- #MA
- #MCD
- #MSFT
- #NTDOY
- #PEP
- #TSLA
- #TWTR
- AUDCAD
- AUDCHF
- AUDJPY
- AUDUSD
- EURCAD
- EURCHF
- EURGBP
- EURJPY
- EURNZD
- EURRUB
- EURUSD
- GBPAUD
- GBPCHF
- GBPJPY
- GBPUSD
- GOLD
- NZDCAD
- NZDCHF
- NZDJPY
- NZDUSD
- SILVER
- USDCAD
- USDCHF
- USDJPY
- USDRUB
- All
- M5
- M15
- M30
- H1
- D1
- All
- Buy
- Sale
- All
- 1
- 2
- 3
- 4
- 5
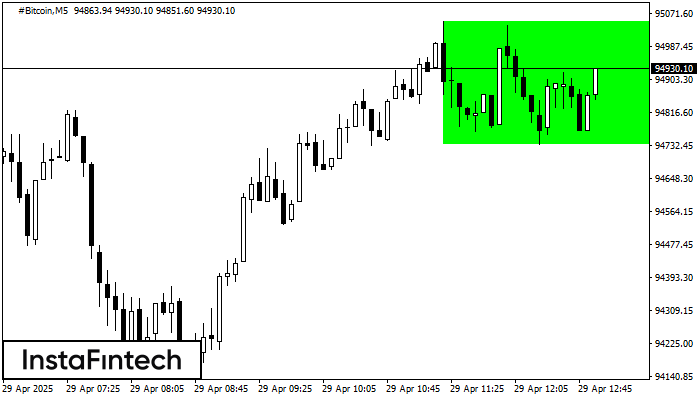
De acordo com o gráfico de M5, #Bitcoin formou Retângulo de alta. O padrão indica uma continuação da tendência. O limite superior é 95051.62, o limite inferior é 94734.72
Os intervalos M5 e M15 podem ter mais pontos de entrada falsos.
Open chart in a new window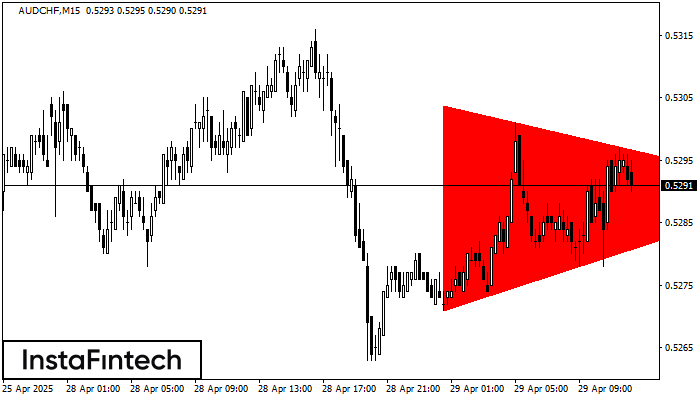
De acordo com o gráfico de M15, AUDCHF formou o padrão de Triângulo Simétrico de Baixa. Recomendações de negociação: Uma quebra do limite inferior de 0.5271 pode encorajar a continuação
Os intervalos M5 e M15 podem ter mais pontos de entrada falsos.
Open chart in a new window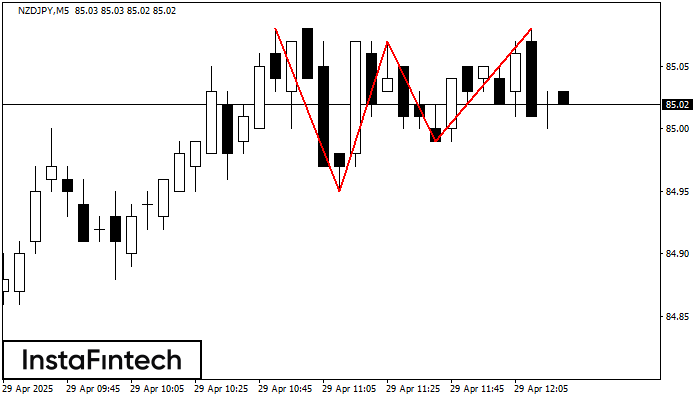
O padrão Topo triplo se formou no gráfico de NZDJPY M5. Características do padrão: os limites têm um ângulo ascendente; a linha inferior do padrão tem as coordenadas 84.95/84.99
Os intervalos M5 e M15 podem ter mais pontos de entrada falsos.
Open chart in a new window