empty
26.09.2022 12:28 PM
Bitcoin forms a descending triangle pattern: will local bottom be updated?

Bitcoin spent the weekend consolidating within a narrow range. The decline in overall trading activity did not affect the cryptocurrency quotes in any way since the interest of retail investors is at a minimum. Bitcoin starts the new week with the formation of a dangerous bearish pattern near the $18.9k level.

After a powerful market crash on September 13 and the formation of one of the largest bearish candles in recent times, BTC/USD has taken a downward direction. On the daily chart of the cryptocurrency, we see a gradual narrowing of the range of fluctuations, which can have far-reaching consequences.

Is the market preparing to sink to the bottom?

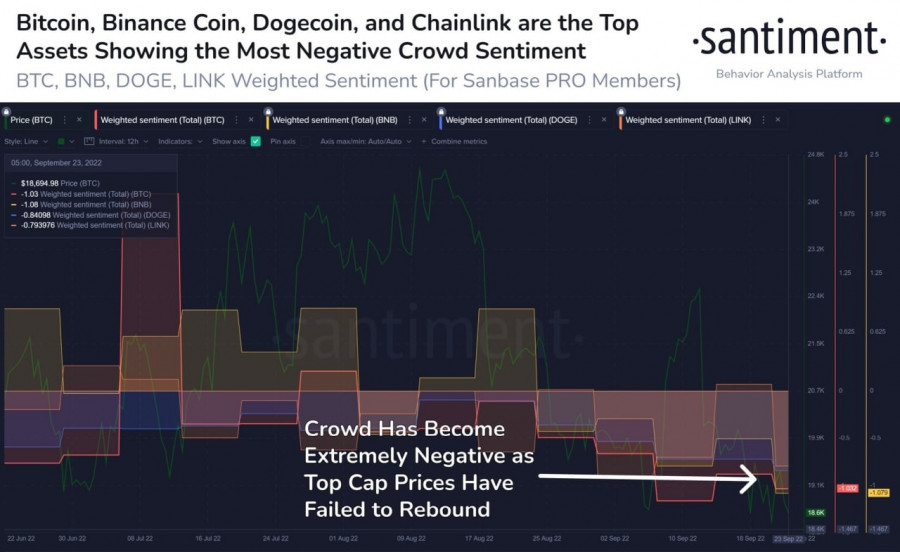
On September 22, buyers formed large volumes and converted them into a green candle. However, it was not possible to develop local success in the future. An unsuccessful attempt to carry out a local rebound exacerbated market sentiment. According to the Santiment report, the cryptocurrency market is experiencing extreme negative sentiment due to failed rebound attempts.

This image is no longer relevant

This leads investors to take concrete action to protect their interests near or below the local low at $17.7k. Each unsuccessful attempt to rebound leads to the saturation of the zone under the local bottom with liquidity. And judging by the price action on the daily chart, the market is gearing up to harvest below $17.7k.

Bitcoin Technical analysis

On the daily chart of BTC/USD, the price is tightening and a descending triangle pattern is forming. The breakdown of this figure will likely be a breakdown of the $17.7k level and an update of the local bottom.

Buying volumes are at their lowest level in the current bear market. Another increase in the key rate is forcing investors to sell their assets in order to avoid margin calls. The result is an ideal situation to update the local bottom and collect large amounts of liquidity below $17.7k.

The formation of a descending triangle may become a prerequisite for a subsequent update of the market bottom. Technical indicators generally show a lull, but, most likely, bearish pressure will resume with the opening of US markets.

Last week, the stochastic oscillator managed to break out of the oversold zone, but subsequently the metric again fell below the 20 level. This is another clear evidence of the weakness of the buyers and the lack of volume needed to protect $17.7k.

S&P 500 Analysis

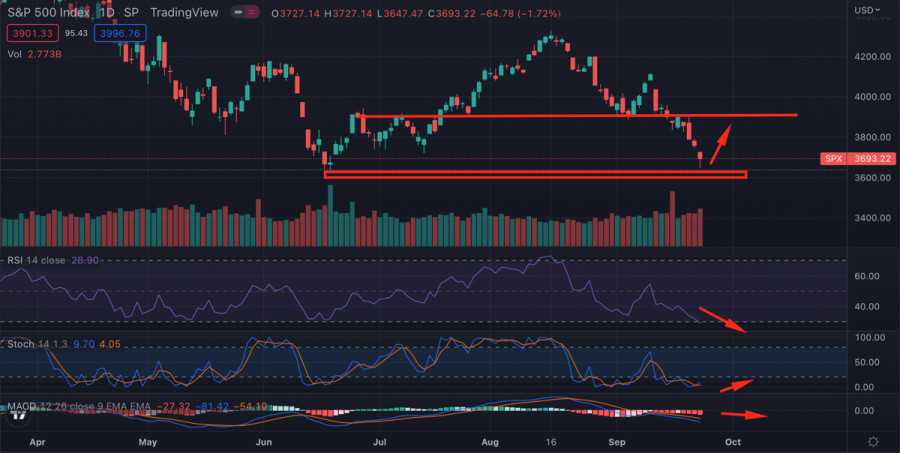
SPX continues to fall and reaches the key support zone at $3,640. Near this level, there are signs of activation of buyers. The bulls managed to move the price away from the important level and as of September 26, the index is trading near $3,700.

This image is no longer relevant

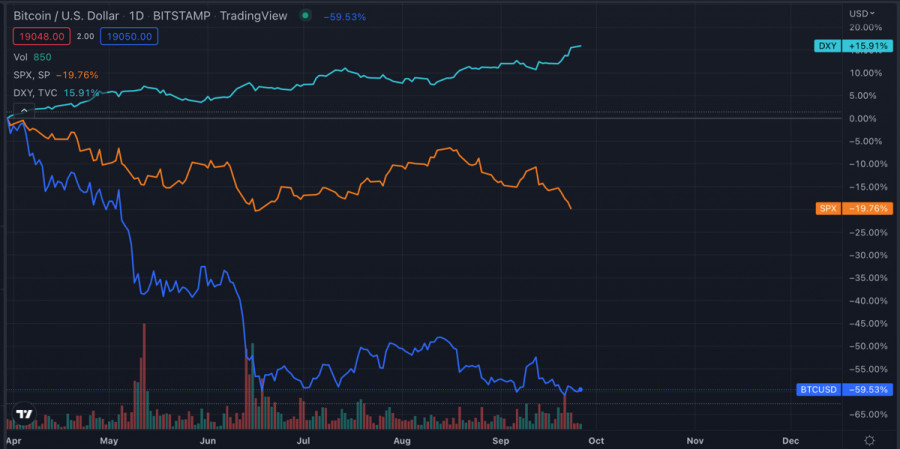
It is important to note that over the past few days, the correlation between Bitcoin and SPX has cracked. The stock index continued to decline while the cryptocurrency stubbornly resisted and remained in a tight range. Judging by the successful rebound of SPX, it will become clear in the near future whether BTC will follow the stock index in an upward movement.

DXY Analysis

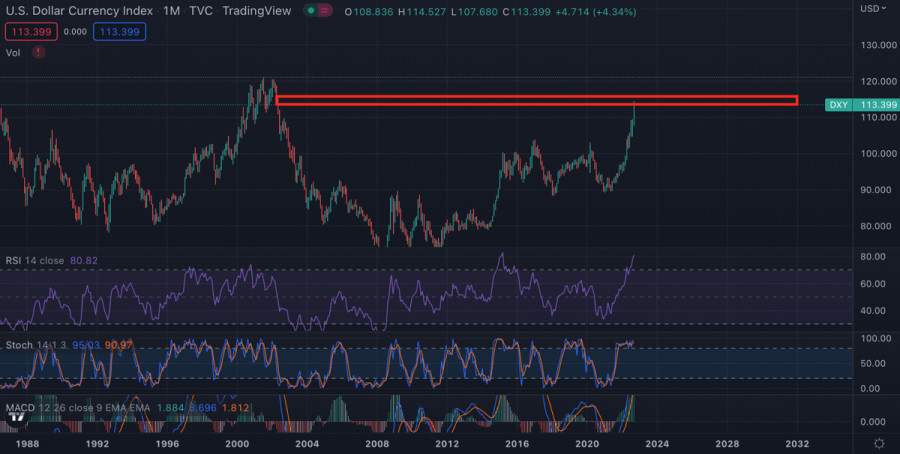
An interesting situation arose with the US dollar index. The asset peaked at 114.5 but subsequently faced increased selling pressure. On the monthly chart, we see that the price has almost reached the high of 2003–2004.

This image is no longer relevant

The technical metrics of the asset on the monthly chart are deep in the overbought zone. It is likely that we will soon face a serious correction in the DXY index, as the asset has reached an absolute peak in all indicators.

Conclusions

There is a high probability that Bitcoin will update the local low in the next two weeks. Technical metrics and another peak moment of negative news have a positive effect on the positions of sellers.

This image is no longer relevant

In the medium term, the markets may be overwhelmed by an upward trend. The impending DXY correction will exceed the drop in the price of the index during the month of the summer. In parallel with the corrective movement of the dollar index, the stock and crypto markets updated local highs. It is likely that we will observe a similar picture in the second half of autumn.

เลือกช่วงเวลา
5
นาที
15
นาที
30
นาที
1
ชั่วโมง
4
ชั่วโมง
1
วัน
1
สัปดาห์
รับผลกำไรจากการเปลี่ยนแปลงอัตราสกุลเงินดิจิทัลกับ InstaForex.
ดาวน์โหลด MetaTrader 4 และเปิดการซื้อขายครั้งแรกของคุณ.
คำแนะนำและการวิเคราะห์การซื้อขายสำหรับ GBP/USD วันที่ 16 เมษายน: ปอนด์ไม่ใช่ยูโร — มันไม่แสดงความอ่อนแอ เมื่อวันอังคารที่ผ่านมา คู่สกุลเงิน GBP/USD ได้เคลื่อนตัวขึ้นตลอดทั้งวัน แม้ว่าจะไม่มีเหตุผลสำคัญหรือพื้นฐานที่ชัดเจนสำหรับการเคลื่อนตัวนี้ แต่ตลาดสกุลเงินโดยรวมก็มักเคลื่อนไหวอย่างสุ่มและไม่มีทิศทางที่แน่นอน ในขณะที่ค่าเงินยูโรตกลง ค่าเงินปอนด์กลับเพิ่มขึ้น และการเคลื่อนไหวเหล่านี้ส่วนใหญ่แทบจะไม่สามารถคาดการณ์ได้ หากทรัมป์ประกาศเก็บภาษีใหม่หรือเพิ่มภาษีที่มีอยู่ ปฏิกิริยาของตลาดก็เป็นสิ่งที่ชัดเจนและสมเหตุสมผล แต่เมื่อวานนี้ ประธานาธิบดีของสหรัฐฯ ไม่ได้ออกมาตรการภาษีใหม่ และข้อมูลเศรษฐกิจมหภาคจากสหราชอาณาจักร
คำแนะนำและการวิเคราะห์การซื้อขายสำหรับ EUR/USD วันที่ 16 เมษายน: ดอลลาร์ได้เปรียบจากช่วงพักภาษี คู่สกุลเงิน EUR/USD เริ่มปรับตัวลงในวันอังคารที่ผ่านมาซึ่งเป็นการลดลงที่คาดหวังมานาน แต่ไม่ได้ลดลงมากนักหรือยาวนานนัก ควรสังเกตว่าไม่มีเหตุผลพื้นฐานใดๆ ที่จะทำให้ค่าเงินดอลลาร์สหรัฐฯ เติบโตในวันอังคาร ดังนั้นสิ่งที่เราเห็นเป็นเพียงการปรับฐานอย่างหนึ่งเท่านั้น นอกจากนี้ ค่าเงินดอลลาร์สหรัฐฯ ได้ลดลงมาเกือบสามเดือนแล้ว โดนแรงกดดันเกือบทุกวันจากนโยบายการค้าของ Donald Trump ซึ่งช่วงที่ผ่านมาสถานการณ์ที่ทำเนียบขาวดูเงียบเหงาเพราะ
  • Grand Choice
    Contest by
    InstaForex
    InstaForex always strives to help you
    fulfill your biggest dreams.
    เข้าร่วมการแข่งขัน


บทความแนะนำ

ข้อเสนอแนะการซื้อขายสำหรับตลาดสกุลเงินดิจิทัลในวันที่ 15 เมษายน

บิทคอยน์สามารถรักษาตำแหน่งได้เป็นอย่างดี โดยเกือบแตะระดับ 86,000 ขณะที่ Ethereum ก็แสดงให้เห็นถึงการเติบโต แต่ได้สูญเสียไปเมื่อสิ้นสุดช่วงเวลาเทรดในสหรัฐฯ ด้วยความตึงเครียดที่ลดลงเกี่ยวกับภาษีศุลกากรของสหรัฐฯ และท่าทีที่อ่อนลงจากประธานาธิบดีทรัมป์ ผู้ซึ่งยังคงมีการยอมผ่อนผัน ตลาดสกุลเงินดิจิทัลแสดงสัญญาณที่ไม่จำเป็นต้องเป็นการฟื้นตัว แต่เป็นการหยุดชั่วคราวที่จำเป็นมาก การหยุดพักนี้ช่วยให้ผู้ค้ามีช่วงเวลาที่หายใจโล่งหลังจากมียอดขายที่ลดลงเมื่อเร็วๆ นี้ ในขณะเดียวกัน

Miroslaw Bawulski 09:08 2025-04-15 UTC+2

คำแนะนำในการซื้อขายสำหรับตลาดคริปโตเคอร์เรนซีวันที่ 14 เมษายน

ในช่วงสุดสัปดาห์ที่ผ่านมา Bitcoin และ Ethereum ได้แสดงให้เห็นถึงความยืดหยุ่นที่ดี โดยยังคงมีโอกาสในการฟื้นตัวต่อไป แม้ว่าจากมุมมองทางเทคนิค โอกาสเหล่านั้นอาจดูน้อยมาก แต่การซื้อขายในช่องแนวนอนก็ยังดูน่าสนใจกว่าการเริ่มขายลดราคา ในทุกกรณี ทิศทางในอนาคตของตลาดสกุลเงินดิจิทัลจะขึ้นอยู่กับพฤติกรรมของตลาดหุ้นสหรัฐฯ เป็นส่วนใหญ่ ซึ่งเมื่อเร็ว ๆ นี้คริปโทฯ

Miroslaw Bawulski 09:12 2025-04-14 UTC+2

ภาพรวมการวิเคราะห์ทางเทคนิคของ Bitcoin

ในสัปดาห์ซื้อขายที่ผ่านมา ตลาดบ่งชี้ถึงโอกาสที่อาจเกิดขึ้นสำหรับฝั่งขาขึ้นในการกลับมาควบคุมอีกครั้ง การที่โอกาสนี้จะเกิดขึ้นได้หรือไม่นั้นขึ้นอยู่กับความสามารถของฝั่งขาขึ้นที่จะออกจากช่วงการรวมตัวเดิม (88743) และทะลุแนวต้านของ Ichimoku ในรายสัปดาห์ (86947 – 87629 และ 92885) และในเมฆรายวัน (91489) ได้หรือไม่

Evangelos Poulakis 06:37 2025-04-14 UTC+2

ทรัมป์ก้าวไปอีกขั้นสู่ตลาดคริปโต

เมื่อวานนี้ Bitcoin และ Ethereum ร่วงหนักในช่วงท้าย แต่ก็สามารถฟื้นตัวกลับมาได้ ในขณะนี้ ฝั่งตลาดหมีมีพลังมากกว่าผู้ซื้อ แต่สิ่งนี้อาจเป็นเพียงชั่วคราว จนกว่า Donald Trump จะตัดสินใจในเรื่องภาษีการค้าและอากร และความวุ่นวายในตลาดหุ้นสงบลง ในระหว่างนี้

Jakub Novak 16:38 2025-04-11 UTC+2

คำแนะนำการซื้อขายสำหรับตลาดสกุลเงินดิจิทัลในวันที่ 11 เมษายน

ค่า Bitcoin และ Ethereum ลดลงในช่วงท้ายของการซื้อขายสหรัฐในวันพฤหัสบดีก่อนจะฟื้นตัวขึ้นอีกครั้งในช่วงการซื้อขายของเอเชียวันนี้ เป็นที่ทราบกันดีว่าตลาดคริปโตมักปรับตัวลดลงตามตลาดหุ้นสหรัฐ ภายหลังมีข่าวว่า Trump เพิ่มภาษีต่อจีนเป็น 145% ซึ่งได้เพิ่มความสับสนและความกังวลให้กับนักลงทุน อย่างไรก็ตาม เนื่องจาก Bitcoin ฟื้นตัวอย่างรวดเร็วในวันนี้

Miroslaw Bawulski 09:28 2025-04-11 UTC+2

การวิเคราะห์ทางเทคนิคของการเคลื่อนไหวของราคาภายในวันของสกุลเงินดิจิทัล Polkadot วันศุกร์ที่ 11 เมษายน 2025

ด้วยการปรากฏของการตีแตกต่างระหว่างการเคลื่อนไหวของราคาของสกุลเงินคริปโต Polkadot และตัวบ่งชี้ Stochastic Oscillator บนกราฟ 4 ชั่วโมงของมัน ตราบใดที่ไม่มีการปรับฐานอ่อนแอที่ทะลุและปิดต่ำกว่าระดับ 3.2460 ในอนาคตอันใกล้ Polkadot มีศักยภาพในการแข็งค่าขึ้นถึงระดับ 3.8461 และถ้าแรงสนับสนุนและความผันผวนในการแข็งค่าเอื้ออำนวย

Arief Makmur 08:52 2025-04-11 UTC+2

การวิเคราะห์ทางเทคนิคของการเคลื่อนไหวของราคาภายในวันของสกุลเงินคริปโต Uniswap, วันศุกร์ที่ 11 เมษายน 2025

จากที่เห็นในกราฟ 4 ชั่วโมงของสกุลเงินดิจิทัล Uniswap ปรากฏว่ามีการเบี่ยงเบนระหว่างการเคลื่อนไหวของราคา Uniswap กับตัวบ่งชี้ Stochastic Oscillator ดังนั้นจากพื้นฐานนี้ ในอนาคตอันใกล้ Uniswap มีศักยภาพที่จะแข็งขึ้นถึงระดับ 5.755 และหากความผันผวนและโมเมนตัมของการแข็งค้ำจุนไว้

Arief Makmur 08:52 2025-04-11 UTC+2

คำแนะนำการซื้อขายสำหรับตลาดสกุลเงินดิจิทัลในวันที่ 10 เมษายน

Bitcoin และ Ethereum ต่างพุ่งขึ้น โดยมีการเพิ่มขึ้นระหว่าง 6% ถึง 10% หลังจากที่ Trump ได้เปลี่ยนใจอย่างกะทันหัน เกิดความรู้สึก FOMO อย่างรุนแรงใน

Miroslaw Bawulski 08:05 2025-04-10 UTC+2

แรงกดดันการขายใน Bitcoin ทำให้กระทิงหาทางยากแม้จะมีการพุ่งตัวขึ้น

บิตคอยน์กําลังดิ่งลงเหว กองทุนต่าง ๆ รายงานความสูญเสีย และนักวิเคราะห์ก็ไม่เห็นเหตุผลใดที่ราคาจะขยับขึ้น แล้วเกิดอะไรขึ้นกับผู้นำของตลาดคริปโตนี้? เราจะทำอย่างไรได้ในสถานการณ์นี้? อีกครั้งที่บิตคอยน์กลายเป็นจุดศูนย์กลางของความไม่มั่นคง ราคากำลังเคลื่อนลงอย่างต่อเนื่อง แม้ว่าจะมีความพยายามฟื้นตัวและเสียงเชียร์จากนักลงทุนเป็นบางครั้ง หลังจากที่ตกลงจาก $94,000 ไปยัง $74,000 และการออกทุนจำนวนมากจากแพลตฟอร์มคริปโต

Ekaterina Kiseleva 12:07 2025-04-09 UTC+2

คำแนะนำในการซื้อขายสำหรับตลาดคริปโตเคอร์เรนซีวันที่ 9 เมษายน

บิตคอยน์และอีเธอเรียมตกลงในช่วงสิ้นวันอังคาร โดยยังคงมีการขายหนักในช่วงเซสชันเอเชียวันนี้ การลดลงอย่างแรงของตลาดหุ้นสหรัฐทำให้สินทรัพย์เสี่ยงอื่นๆ ลดลงตามไปด้วย รวมถึงตลาดคริปโตเคอร์เรนซีเช่นกัน ในเดือนกุมภาพันธ์ 2025 Bitcoin ได้ลดลงต่ำกว่าราคาเฉลี่ยที่ผู้ถือครองระยะสั้นสามารถทำกำไรได้ และเมื่อวานนี้ก็มาถึงคราวของ Ethereum ตามข้อมูลจาก CryptoQuant การที่

Miroslaw Bawulski 09:22 2025-04-09 UTC+2
หากไม่สะดวกคุยในตอนนี้
ระบุคำถามไว้ได้ใน แชท.
Widget callback
 

Dear visitor,

Your IP address shows that you are currently located in the USA. If you are a resident of the United States, you are prohibited from using the services of InstaFintech Group including online trading, online transfers, deposit/withdrawal of funds, etc.

If you think you are seeing this message by mistake and your location is not the US, kindly proceed to the website. Otherwise, you must leave the website in order to comply with government restrictions.

Why does your IP address show your location as the USA?

  • - you are using a VPN provided by a hosting company based in the United States;
  • - your IP does not have proper WHOIS records;
  • - an error occurred in the WHOIS geolocation database.

Please confirm whether you are a US resident or not by clicking the relevant button below. If you choose the wrong option, being a US resident, you will not be able to open an account with InstaForex anyway.

We are sorry for any inconvenience caused by this message.